 In our increasingly data-driven world, it is more important than ever to have easily accessible ways to view and understand data. As “Big Data” grows bigger, explanatory visualizations are increasingly necessary to make sense of the trillions of rows of data generated every day. Combining data with great storytelling using pictorial symbols create a visual form that is universally accessible regardless of literacy or culture. Such transformation of complex information into self-explanatory visuals has been achieved through the use of a different type of art: Isotypic art. Through the use of Isotypes, informative messages are conveyed with combinations of not only shapes and colors but also tabular, graphical, map schematics and other pictorial figures in serial repetition.
Otto Karl Wilhelm Neurath, an Austrian-born philosopher of science, sociologist, and political economist, invented the ISOTYPE (International System of Typographic Picture Education), during the late 1920s. It was first known as the Vienna Method of Pictorial Statistics (Wiener Methode der Bildstatistik), because it was developed at the Gesellschafts- und Wirtschaftsmuseum in Wien (Social and Economic Museum of Vienna). The term Isotype was applied to the method around 1935, after its key practitioners were forced to leave Vienna during the rise of Austrian fascism. The Isotype with its incredible versatility and depth remains the foremost influence on data visualization worldwide.
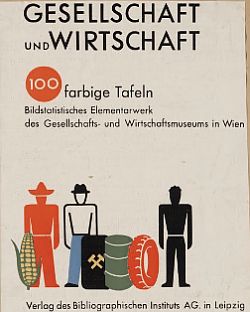
It was only when Neurath started to collaborate with the German artist, Gerd Arntz, that the idea of the Isotype got the necessary graphic power to expand its reach. Die bunte Welt (The colorful world), published in 1929, was the first publication of the Vienna Method of Pictorial Statistics and the first appearance of Arntz’s clarity and precision in the Isotype graphic form. The book was designed to be suitable for older children but the complexity of the charts invoked a broader adult audience. The following year Neurath and Arntz released a groundbreaking publication on information visualization: Bildstatistisches Elementarwerk published in Leipzig by Bibliographisches Institut. The book contains 100 illustrations in color presented by Gesellschafts- und Wirtschaftsmuseum. A copy of this scarce book sold at a Christie’s auction in December 2010 for $6,250, more than double its estimate. More recently, a second copy of the book was sold by U.K. book dealer, Peter Harrington for £7,500.
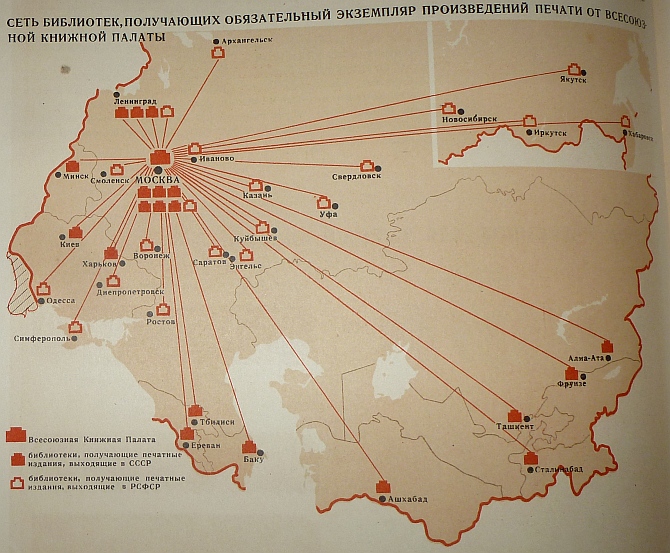
In 1931, Otto Neurath and his assistants travelled to Russia in order to train Russian artists and technicians in the Vienna Method of Pictorial Statistics. He had agreed to help establish an institute for pictorial statistics referred to as the Izostat Institute. The actual name was ‘The All-Union Institute of Pictorial Statistics of Soviet Construction and Economy’ (Vsesoiuznyi institut izobrazitel’noi statistiki sovetskogo stroitel’stva i khoziaistva). Some of the scarcest works published by the Izostat Institute include: The Struggle for Five Years in Four, published in 1932 and The Second Five-Year Plan in Construction published in 1934.1
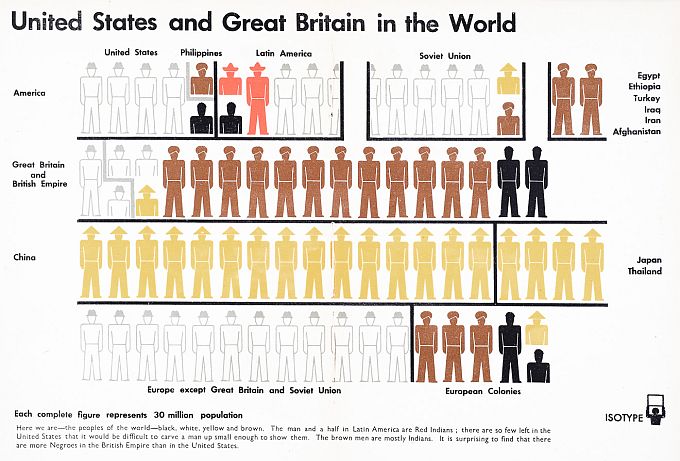
Back to Vienna, Neurath was forced to flee to Holland where he met his future wife Marie Reidemeister, after the 8th Army of the German Wehrmacht crossed the border into Austria. The couple was forced to move again in 1940 to England where they established the Isotype Institute in Oxford, in 1942. Marie Neurath was the Isotype transformer, the real designer of the work which she continued after her husband’s death in 1945. During the first three years of the Isotype Institute’s existence, while Otto was still alive, the focus was in the production of charts in wartime publications sponsored by the Ministry of Information: The New Democracy series published by Nicholson & Watson; and a few titles published by George G. Harrar & Co Ltd.
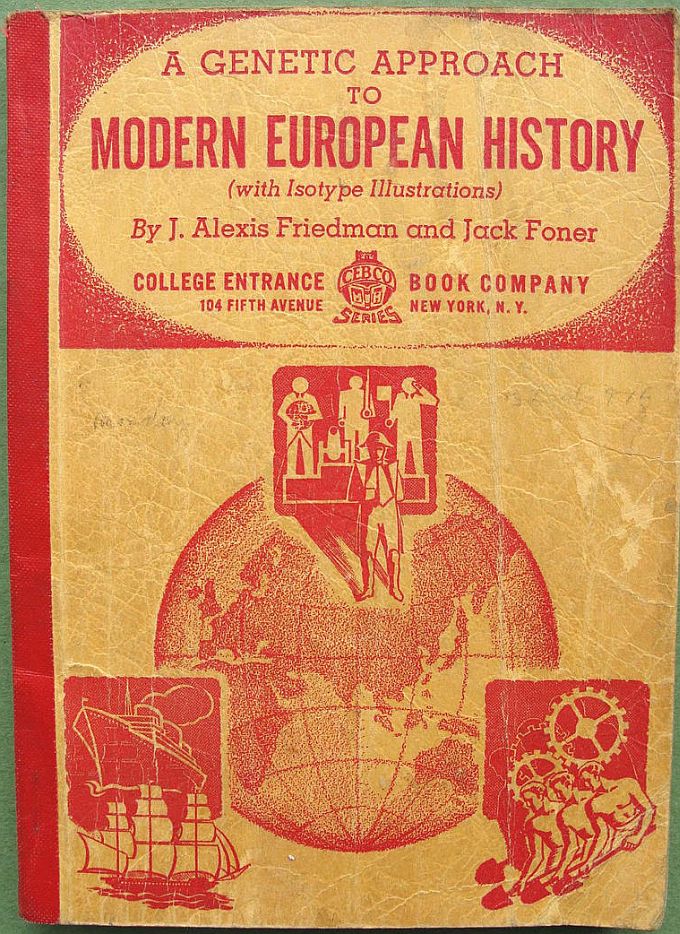
Rudolf Modley who served as an assistant to Otto Neurath in Vienna, introduced the Isotype methods to the United States through his position as chief curator at the Museum of Science and Industry in Chicago. His work was not a linear continuation of Isotype, but an attempt to adapt the visual language to American conditions. “Neurath’s method Americanized” was the slogan used to promote the book Rich Man, Poor Man: Pictures of a Paradox (New York: Harper and Brothers, 1935), in an advertisement in the American magazine Survey Graphic. A few years later, A Genetic Approach to Modern European History (New York: College Entrance Book Company, 1938), printed the title addendum “with Isotype Illustrations” on the front cover.
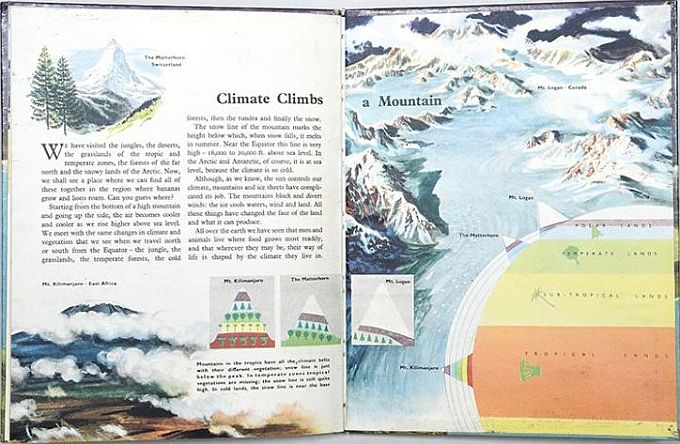
Marie Neurath continued the work after her husband’s death and under her direction, between 1947 and the late 1960s; the Isotype Institute produced many books for children series. A great example of her transformative ingenuity is printed on the last page of Icebergs & Jungles, which was published in 1954. In a graphic representation she helps the reader visualize the effects of altitude and latitude to the mountains of Mt. Logan, The Matterhorn and Mt. Kilimanjaro. It is incredible how she was able to pack all the informative data in a single, self-explanatory, visual representation.
Since its inception, the visual data vocabulary conceived by Otto Neurath, has served a broad audience who adopted his new method of information visualization. Even after the explosion of computer use, the Isotype maintained its spot with the new tools of information representation and graphic design. Whether AI will have an impact on Isotypes remains to be seen. As large language models (LLMs), are now capable of generating text on a seemingly endless range of topics with or without “hallucinations,” the day when AI starts using a visual data vocabulary may not be too far off.
1‘Isotype revisited’ Eric Kindel and Sue Walker, with additional commentary by Christopher Burke, Matthew Eve and Emma Minns (2010)
{ 0 comments… add one now }