 The year 2025 marked the 250th anniversary of Jane Austen’s birth (December 16, 1775). This milestone sparked increased interest in the years leading up to it. On the collecting side, skyrocketing demand and prices across Austen memorabilia drove record-setting results, including the most expensive Austen printed work sold to date: an inscribed Emma selling for £375,000 in 2022. The anniversary year increased demand for later 19th–20th century collectible editions as well, but it has not transformed the fundamental value dynamics—which remain governed by modest appreciation when demand outstrips limited supply. The publishing world also celebrated with special limited editions, such as a spectacular Folio Society release of all six novels, further stimulating the market for existing rare copies. The Complete Novels edition celebrating the 250th anniversary was released in a limited print run (circa 750 copies) with bespoke illustrations and high-quality production.
2025 also marked the deaths of several authors: Tom Stoppard, Mario Vargas Llosa, Frederick Forsyth, and Jane Gardam. Stoppard was a globally celebrated playwright, screenwriter, and Oscar winner, with a career spanning six decades and multiple Tony Awards. His passing cemented the high-value status of his already sought-after publications.
The market for Vargas Llosa’s work is driven by his status as a Nobel Laureate (2010) and his appeal as a giant of the Latin American Boom. Collectors prioritize first editions in Spanish from publishers like Seix Barral (Spain), along with Latin American and U.S. signed editions. Ample supply held prices steady despite increased posthumous attention.
Global bestseller and commercial thriller master Frederick Forsyth has a broad but comparatively shallower market depth. Demand for collectible, signed first editions of The Day of the Jackal remain strong. Values are moderate to high, but less consistent than those of Nobel or Booker winners.
Jane Gardam—primarily British/Commonwealth, critically acclaimed, and known for a “quiet” style—has a growing niche market. She is showing a significant percentage jump in prices for signed first UK editions of key works like Old Filth. Values are moderate but rising. While prices have moved up, they remain significantly lower than those for Stoppard, Vargas Llosa, and Forsyth. Her market is more niche, and even top-tier copies are generally selling under $300.
Movie deals are often the tipping point from cult favorite to mainstream success, especially when timed closely to a book’s release. In 2025, several high-profile adaptations kept collectors watching the shelves as closely as the screens: The Long Walk (Stephen King writing as Richard Bachman, 1979), The Chronology of Water (Lidia Yuknavitch, 2011 memoir), and Regretting You (Colleen Hoover, 2019). While none created a sudden “overnight” rare-book phenomenon, collectible copies are in demand.
Stephen King, with 37 productions, is no newcomer to film adaptations. His 2025 release draws from his early years, when he wrote under Richard Bachman. Even though his last production, Lisey’s Story, was four years ago, The Long Walk was not a blockbuster by 2025 standards—but it was a solid performance, nevertheless. This adaptation likely cannot boost King’s collectability much further, since his market is already mature and heavily trafficked.
Yuknavitch’s 2011 memoir, The Chronology of Water, premiered at Cannes 2025 and saw theatrical/limited releases late in the year, with wider theatrical expansion scheduled for early 2026. The book has already developed a cult following, and first editions from 2011 are very scarce. The title also traces back to a short story Yuknavitch published in 1997 in the little-known softcover, Her Other Mouths, which contains the first appearance of Chronology of Water.
Regretting You showed that poignant contemporary novel adaptations can break into mainstream box office totals even without franchise status. While not a top-tier grosser, it performed respectably internationally and led to new editions in multiple languages. The US book, published by Montlake, an Amazon imprint with high volume productions in romance novels, has no collectible value. Gen Z and millennials are engaging with romance in huge numbers creating a commercial powerhouse and a vibrant cultural force, but the general collectible value remains a niche outside the antiquarian market.
The huge success of Mick Herron’s Slow Horses spy series was recognized in 2025 with the Crime Writers’ Association (CWA) Diamond Dagger. The fifth series, based on London Rules, was a major success, and the sixth season will blend storylines from Joe Country (Book 6) and Slough House (Book 7). Needless to say, prices for first editions across the series have risen significantly. Herron’s first novel, Down Cemetery Road (Baskerville), was published in 2003, marking the start of the Zoë Boehm series, which was also adapted into a major Apple TV series starring Emma Thompson and Ruth Wilson in 2025.
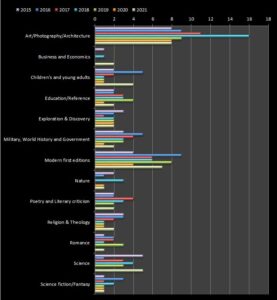
Our Rare Book Sale Monitor recorded no significant appreciation for the most popular author of the last decade, J.K. Rowling. The huge price hikes of prior years—coupled with a lack of any significant new catalyst—may have finally put the brakes on significant price appreciation for J.K. Rowling. The following chart shows what the Monitor placed at the top of genre movers, along with the impactful authors, during 2025 as compared with the prior 10-year normalized median.

2025 Top Author × Category Movers (vs. Prior 10 Years)
| Author | Category | Collector read |
| Ayn Rand | Science Fiction, Fantasy | Structural repricing of true first-edition comparables |
| J.R.R. Tolkien | Science Fiction, Fantasy | Scarcity + deep collector demand remain durable |
| Harper Lee | Fiction | Blue-chip first editions behave like a long-term store of value |
| William Gibson | Science Fiction, Fantasy | Canonical genre maturation; collector base expanding |
| J.K. Rowling | Science Fiction, Fantasy | Flat in 2025; prior years’ gains appear to be consolidating |
| Feynman / Darwin | Science | Underperformed; market sensitive to substitution and supply depth |
Ultimately, 2025 reinforced a familiar truth in the rare book world: the strongest price performance comes from scarcity, condition, and narrative, not from popularity alone. Anniversary attention, author passings, and screen adaptations can all act as accelerants—but only when they land on genuinely limited supply and collector-grade copies. For collectors, this was yet another year to stay selective: prioritize the right editions and treat “headline excitement” as an entry point—not a substitute for fundamentals.
For this story, Rare Books Digest used generative AI to help with an initial draft. An editor verified the accuracy of the information before publishing.
{ 0 comments }